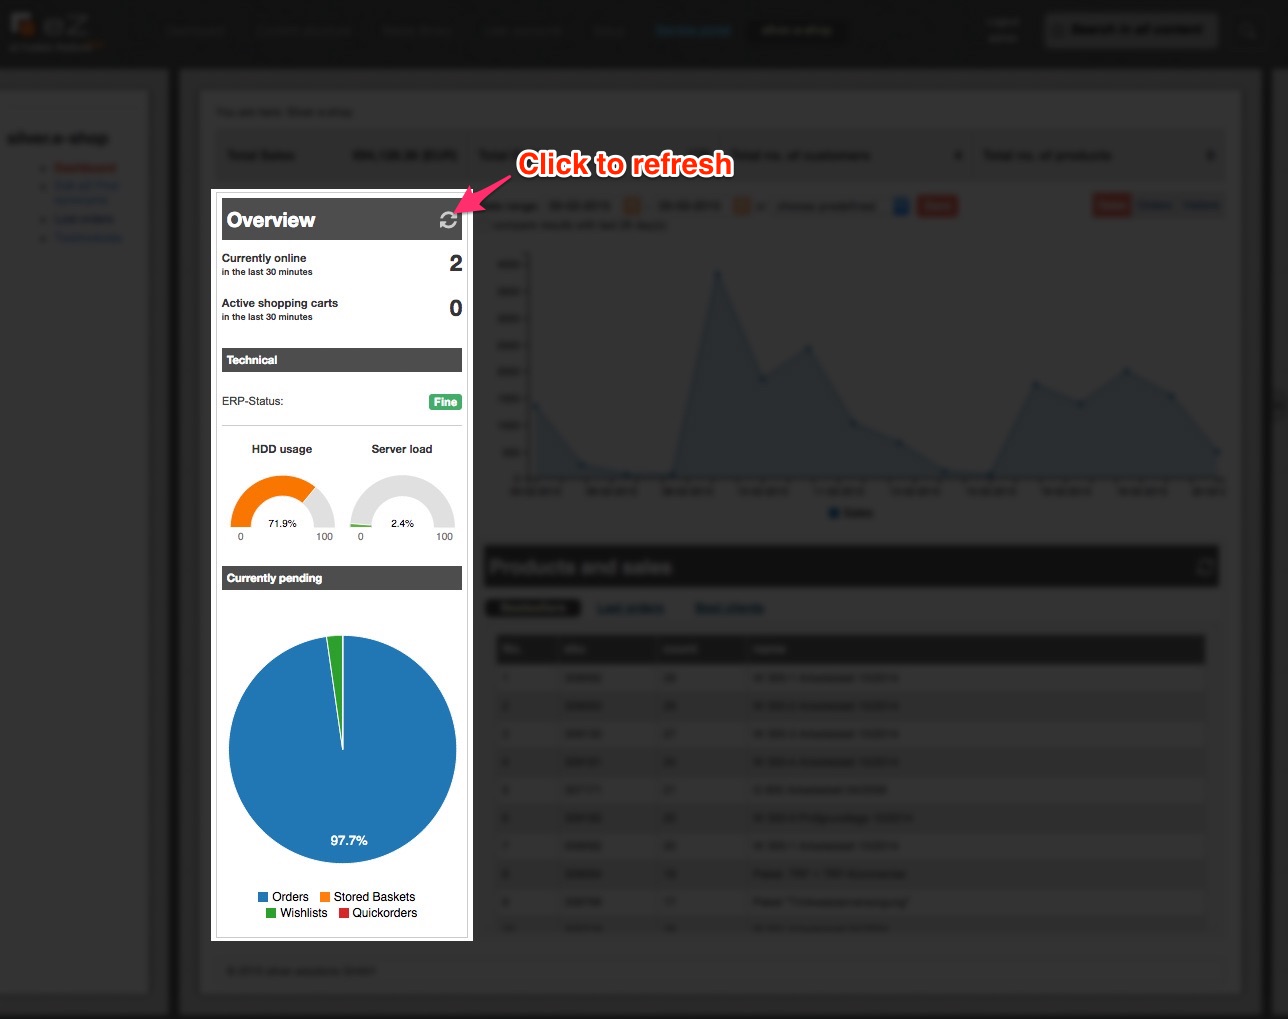
New e-Commerce Cockpit for silver.e-shop
More control over figures and numbers
Shop owners or shop managers always need to have the best possible overview of performance statistics, sales figures and other key factors in the sales process. For B2B web shops most of those statistics and data are pulled from the ERP system and connected BI tools. Those are powerful tools with some of the most advanced features for reports and statistics. But what about quick insights into the current shop performance or some reliable numbers on shop usage? We are regularly asked for a simple tool that is already integrated into the shop itself and supports shop managers in their daily work. With this specific need in mind the monitoring tool of our e-Commerce solution silver.e-shop has been totally reworked and updated. The e-Commerce Cockpit now presents shop managers with all relevant information at a glance.
Detailed reports can be performed using the reporting function of the ERP-system or additional tracking tools such as Google Analytics.
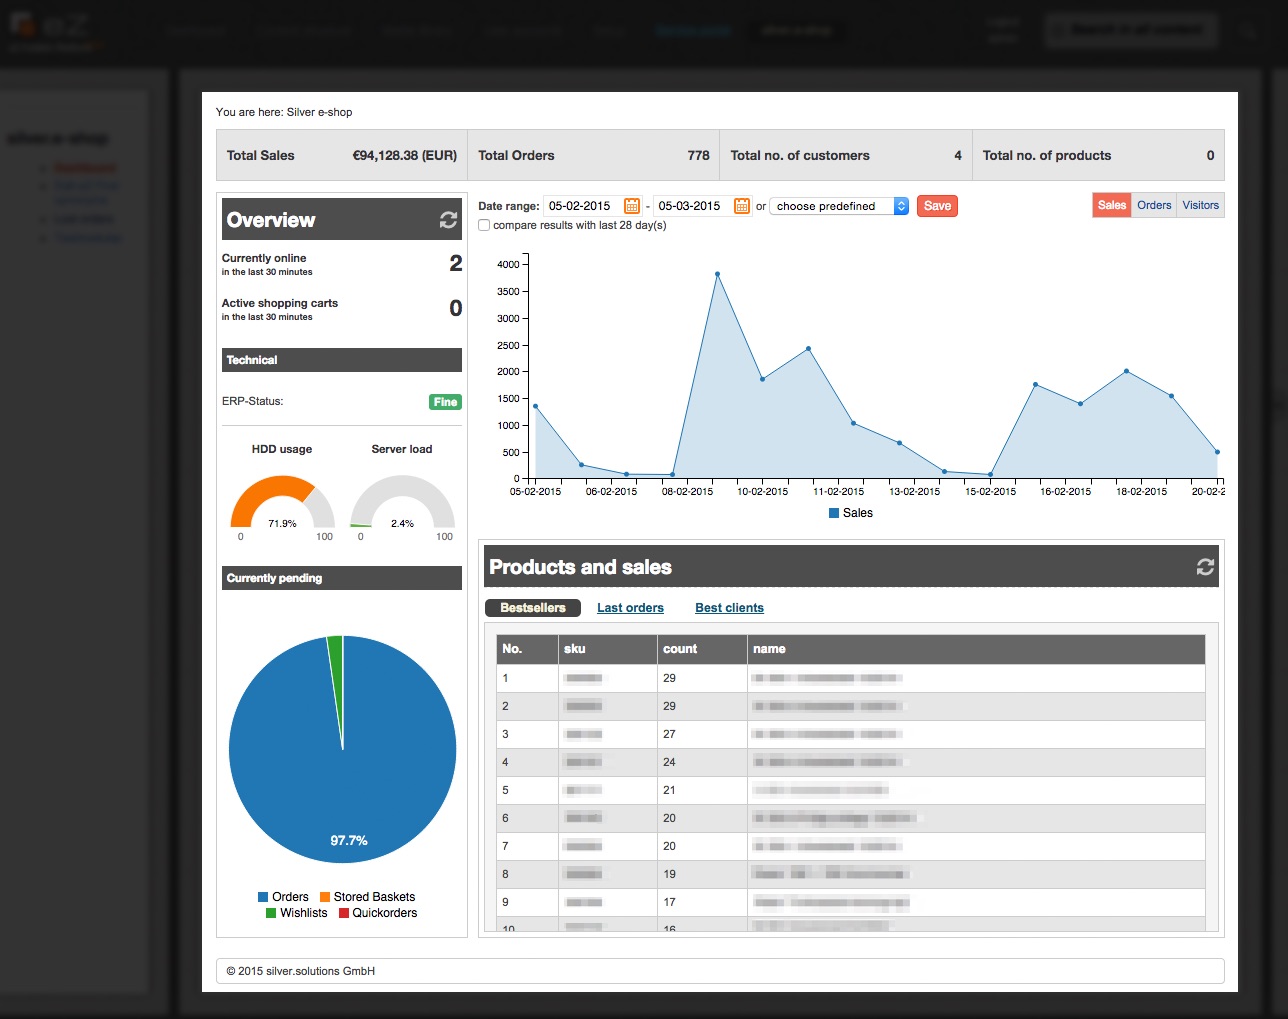
The totals
For a first overview this section currently shows total sales value in shop currency, total number of orders, total number of customers that have ordered so far, total number of active products in the shop.
The status
Monitoring the technical status of the shop and keeping an eye on the ERP connection is what this section does. This way it helps to detect technical problems early on and the shop owner can initiate the needed measures to get the system up and running again.
Technical statistics
- ERP Status
- HDD usage
- Server load
The ERP Status indicates that some time in the recent past an ERP request has failed and that the shop has paused the connection to the ERP system. The cockpit will prominently display the ERP Status with a red icon until the ERP is available again.
Current usage of shop
- Users currently online (over the last 30 minutes)
- Active shopping carts (in last 30 minutes)
- Orders
- Orders which have not yet been transferred to the ERP yet (e.g. due to connection problems)
- Stored Baskets (if available in this shop)
- Wishlists (if available in this shop)
- Quickorders (if available in this shop)
- Currently pending orders, wish lists, quick orders and stored baskets in percent (depending on availability in this shop)
The Main Chart
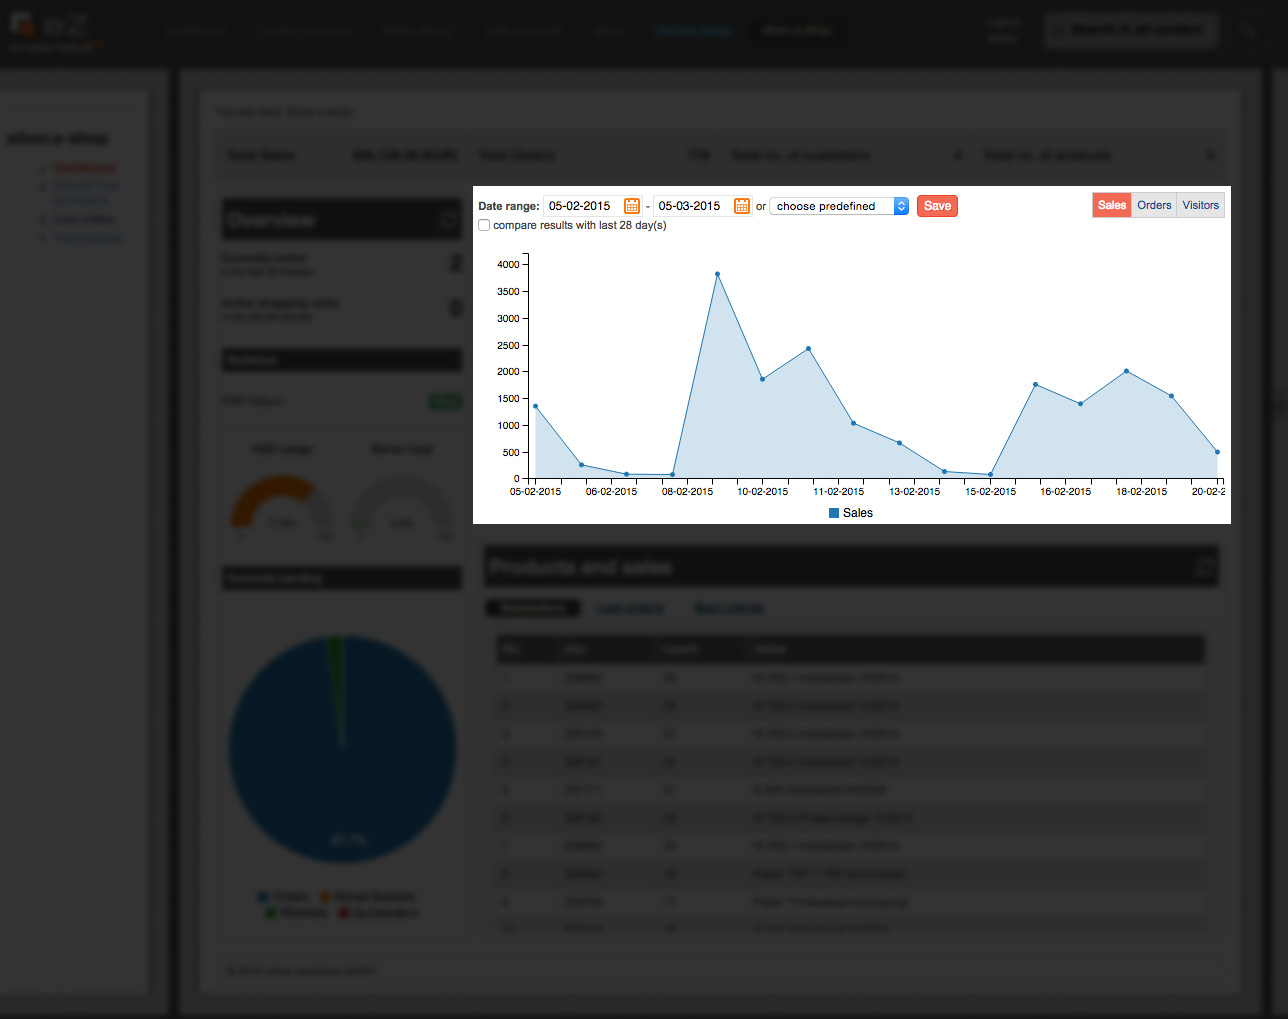
The main chart is something like the heart of the e-Commerce cockpit as it displays specific key numbers over a time period that can be individually defined. Currently the main chart can provide shop owners with the following numbers:
- Sales – shows order value in chosen time frame
- Orders – shows number of orders in chosen time frame
- Visitors – shows users that were online during the chosen date range
Currently available date range:
- this week
- this month
- last 7 days
- last 14 days
- last 30 days
- individual date range
To get a better feeling for the performance of the shop over time the cockpit can also provide comparisons, for example total order value over the course of the last 7 days compared to the 7 days before that.
Top Charts
The fourth section of the e-Commerce Cockpit collects top lists of bestselling products (Top 20), last orders (Last 365) and clients with highest sales numbers (Top 20).
The Technology
Our e-Commerce Cockpit is fully integrated into the shop backend and can be made accessible by the eZ roles and rights management.
The dashboard can be extended in projects if specific data shall be displayed as well.
The charts are generated with C3.js library which is a wrapper for D3.js.
Outlook
The eCommerce Cockpit is only in the beginning stages and there are already more ideas for additional features being thrown back and forth. Depending on the individual ERP connection there are endless possibilities to provide the maintainer of the shop with data they can work with.
https://blog.silversolutions.de/2015/04/b2b-strategie/e-commerce-cockpit-silver-e-shop/https://blog.silversolutions.de/wp-content/uploads/2018/12/tools-tipps_dummy.pnghttps://blog.silversolutions.de/wp-content/uploads/2018/12/tools-tipps_dummy-150x150.pngB2B.strategieB2B.technologieB2B,E-Commerce,silver.eShop,ToolsMore control over figures and numbers Shop owners or shop managers always need to have the best possible overview of performance statistics, sales figures and other key factors in the sales process. For B2B web shops most of those statistics and data are pulled from the ERP system and connected BI tools....Susan GutperlSusan Gutperlsug@silversolutions.deAdministratorSusan Gutperl war von 2009 bis 2018 als Marketing- und Content-Managerin bei silver.solutions tätig. Hier im Blog war Susan zuständig für Redaktionsplan, Marketing-orientierte Artikel, bemühte sich um die Motivation der IT-Kollegen zum Schreiben von Beiträgen und übernahm die Endredaktion. Nach dem Studium der Verlagsherstellung hat sie bei einem IT-Dienstleister, einer Internet-Agentur, einem Fachverlag und einem Internet-Startup in den Bereichen Projektmanagement und Marketing/Vertrieb das Internet von verschiedenen Blickwinkeln kennengelernt und neue Entwicklungen mit begleitet.silver.solutions


